The Costs of Smart Growth Revisited: A 40 Year Perspective
by Wendell Cox 07/08/2011
"Soaring" land and house prices "certainly represent the biggest single failure" of smart growth, which has contributed to an increase in prices that is unprecedented in history. This finding could well have been from our new The Housing Crash and Smart Growth, but this observation was made by one of the world's leading urbanologists, Sir Peter Hall, in a classic work 40 years ago. Hall led an evaluation of the effects of the British Town and Country Planning Act of 1947 (The Containment of Urban England) between 1966 and 1971. The principal purpose of the Act had been urban containment, using the land rationing strategies of today's smart growth, such as urban growth boundaries and comprehensive plans that forbid development on large swaths of land that would otherwise be developable.
The Economics of Urban Containment (Smart Growth): The findings of Hall and his colleagues were echoed later by a Labour Government report in the mid-2000s which showed housing affordability had suffered under this planning regime. Author Kate Barker was a member of the Monetary Policy Committee of the Bank of England, which like America's Federal Reserve Board, is in charge of monetary policy. Among other things, the Barker Reports on housing and land use found that urban containment had driven the price of land with "planning permission" to many multiples (per acre) above that of comparable land where planning was prohibited. Under normal circumstances comparable land would have similar value.
Whether coming from the left or right, economists have demonstrated that prices tend to rise when supply is restricted, all things being equal. Certainly there can be no other reason for the price differentials virtually across the street that occur in smart growth areas. Dr. Arthur Grimes, Chairman of the Board of New Zealand's central bank (the Reserve Bank of New Zealand), found the differential on either side of Auckland's urban growth boundary at 10 times, while we found an 11 times difference in Portland across the urban growth boundary.
House Prices in America: The Historical Norm: Since World War II, median house prices in US metropolitan areas have generally been between 2.0 and 3.0 times median household incomes (a measure called the Median Multiple). This included California until 1970 (Figure 1). After that, housing became unaffordable in California, averaging nearly 1.5 times that of the rest of the nation during the 1980s and 1990s (adjusted for incomes). Even after the huge price declines from the peak of the bubble, house prices remain artificially high in Los Angeles, San Francisco, San Diego and San Jose, with median multiples of six or higher.
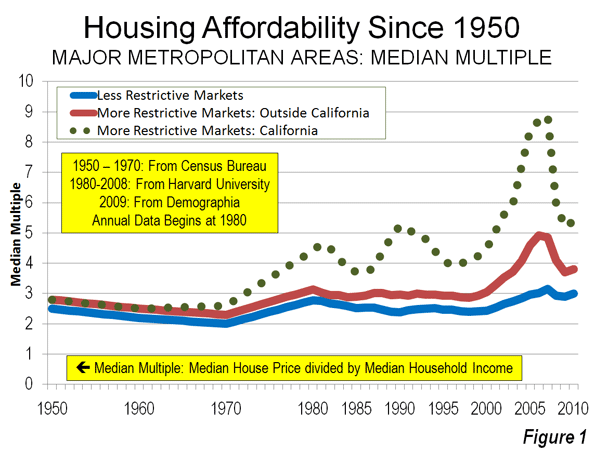
William Fischel of Dartmouth University examined a variety of justifications for the disproportionate rise of California housing prices and dismissed all but more restrictive land use regulation. He noted that "growth controls (restrictive land use regulations) have the undesirable effect of raising housing prices." Throughout the rest of the nation, more restrictive land use regulations have been present in every market where house prices rose substantially above the historic Median Multiple norm, even during the housing bubble. No market without smart growth has ever reached these heights.
Setting Up for the Fall: Excessive Cost Increases in Smart Growth Markets: The Housing Crash and Smart Growth, published by the National Center for Policy Analysis, examined the causes of house price increase during the housing bubble. The analysis included all metropolitan areas with more than 1,000,000 population. It focused on 11 metropolitan areas in which the greatest cost increases occurred (the "ground zero" markets), comparing them to cost increases in the 22 metropolitan areas with less restrictive land use regulation (Note 1).
Less Restrictively Regulated Markets: In the less restrictively regulated
markets, the value of the housing stock rose approximately $560 billion, or
28 percent from 2000 to the peak of the bubble (Note 2). In nearly all of these
markets, the Median Multiple remained within the historical range of 2.0 to
3.0 and none approached the high Median Multiples that occurred in the "ground
zero" markets.
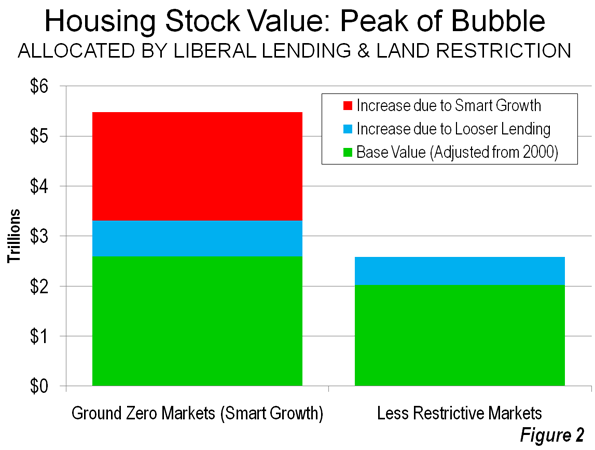
Ground Zero Markets The value of the housing stock rose $2.9 trillion from 2000
to the peak of the bubble in the "ground zero" markets, all of which
have significant land use restrictions (Note 3). The 112 percent increase in
the "ground zero" markets was four times that of the less restrictively
regulated markets. The Median Multiple rose to unprecedented levels in each
of the "ground zero" markets, peaking at from 5.0 to more than 11.0,
four times the historic norm.
The 28 percent increase in relative house value that occurred in the less restrictively regulated markets (those without smart growth) is attributed to the influence of loosened lending standards. The excess above 28 percent, which amounts to $2.2 in the "ground zero" markets is attributed to to the supply restricting strategies of smart growth (Figure 2).
The Fall: Smart Growth Losses
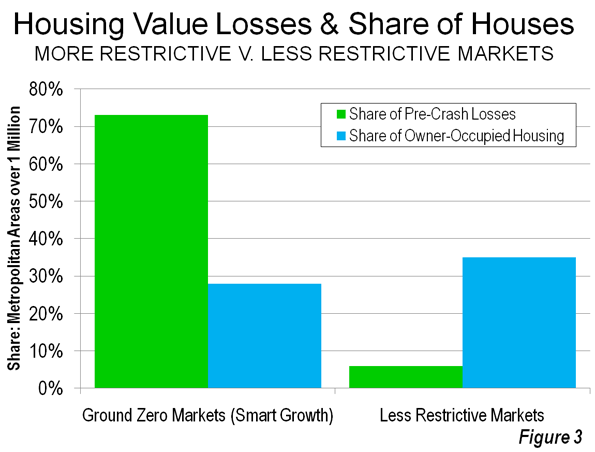
The largest house price drops occurred in the markets that had experienced the greatest cost escalation, both because prices were artificially higher but also because prices in smart growth markets are more volatile. The "ground zero" markets, with only 28 percent of the owner occupied housing stock, accounted for 73 percent of the pre-crash losses ($1.8 trillion). Thus, much of the cause of the housing crash, which most analysts date from the Lehman Brothers bankruptcy (September 15, 2008), can be attributed to these 11 metropolitan areas.
By contrast, the 22 less restrictively regulated markets accounted for only six percent ($0.16 trillion) of the pre-crash losses. These 22 markets represented 35 percent of the owned housing stock (Figure 3).
If the losses in the ground zero markets had been limited to the rate in the less restrictively regulated markets (the estimated impact of cheap credit), losses would have been $1.6 trillion less (Note 4). The Great Recession might not have been so "Great."
Economic Denial and Acknowledgement: In his writing forty years ago, Dr. Hall noted that English planners denied the connection between the unprecedented house price increases and urban containment. This same denial also informs smart growth advocates today. This is perhaps to be expected, because, as Hall noted 40 years ago, an understanding of the longer term consequences would have undermined support for these policies.
To their credit, some advocates recognize that smart growth raises house prices. The Costs of Sprawl – 2000¸ a volume largely sympathetic to smart growth, also indicates that urban containment strategies can raise housing prices. The only question is how much smart growth raises house prices. The presence of urban containment policy is the distinguishing characteristic of metropolitan markets where prices have escalated well beyond the historic norm.
The Social Costs of Smart Growth: Moreover, the social impacts of smart growth are by no means equitable. Peter Hall says that the "less affluent house-owner ... has paid the greatest price for (urban) containment" (Note 5). He continues: "there can be little doubt about the identity of the group that has got the poorest bargain. It is the really depressed class in the housing market: the poorer members of the privately-rented housing sector." Finally, Hall laments as well the impact of these policies on the "ideal of a property owning democracy."
Hall's four decades old concern strikes a chord on this side of the Atlantic. Just last week, a New York Times/CBS News poll found that nine out of ten respondents associated home property ownership with the American Dream. Planning needs to facilitate people's preferences, not get in their way.
--------
Note 1: The housing stock value uses a 2000 base, which adjusts house prices based upon the change in household incomes to the peak.
Note 2: The underlying demand for housing was substantial in some of the less restrictively markets, which is illustrated by the strong net domestic migration to metropolitan areas such as Atlanta, Austin, Dallas – Fort Worth, Houston, Raleigh and San Antonio. At the same time, some more restrictive markets (smart growth) that hit historically experienced strong demand were experiencing huge domestic outmigration, indicating little in underlying demand. This includes Los Angeles, San Francisco, San Diego and San Jose. Demand, however is driven upward in more restrictively metropolitan areas by speculation which, according to the Federal Reserve Bank of Dallas is attracted by supply constraints.
Note 3: The 11 "ground zero" metropolitan markets were Los Angeles, San Francisco, San Diego, San Jose, Sacramento, Riverside-San Bernardino, Las Vegas, Phoenix, Tampa-St. Petersburg, Miami and the Washington, DC area.
Note 4: The pre-crash losses in the 18 other restrictively regulated markets were $0.5 trillion. These markets accounted for 37 percent of owner occupied housing in the metropolitan areas of more than 1,000,000 population, compared to 35 percent in the less restrictively regulated markets, yet had losses three times as high.
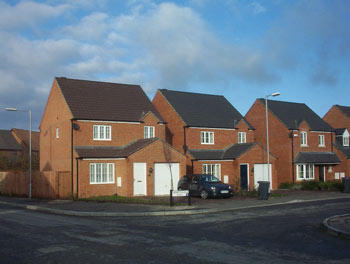
Note 5: The Containment of Urban England also indicates that new house sizes have been forced downward by the planning regulations (see photo at the top of the article).
Photograph: New, smaller exurban housing in the London area (by author)
Wendell Cox is a Visiting Professor, Conservatoire National des Arts et Metiers, Paris and the author of “War on the Dream: How Anti-Sprawl Policy Threatens the Quality of Life”
Submitted by Jonathan Hopkins on Sat, 07/09/2011 - 11:04.
Urban living generally costs less than suburban living so long as you live
an urban lifestyle in an urban setting. People often run into financial problems
in cities when they attempt to live suburban lifestyles in them ie owning multiple
vehicles, driving everyday to their child's day care or school, to work, for
shopping and recreation and then back home. However, if families were to instead
take advantage of existing transit, walk, bike and purchase or rent housing
closer to their employment, they would easily have a much lower cost of living
than a comparable family living in a newer suburban area. Trying to maintain
a suburban standard of living in a city can also be extremely expensive, but
it is also completely unnecessary since city neighborhoods often provide parks,
recreational facilities, and enough entertainment to replace the need for large
private lots, playground equipment, and large housing foot prints since the
neighborhood provides many of these things and the cost is shared amongst the
entire population rather than each individual household. It can also be seen
that the quality of life in traditional neighborhoods in cities is much higher
than any other development pattern.
Cities offer the ability to live very inexpensively in small square footage
dwellings with access to transit, walking networks and bike infrastructure and
many publicly-owned facilities that allow one to spend very little time in their
home and not spend much money for entertainment, socializing, etc. Cities also
allow people to live suburban style lifestyles on big lots, in big houses that
are accessed by car - although it will cost more to live this lifestyle in a
city as compared to new suburban fringe development.
Suburbs, however, do not offer the choice to live compactly and in a complete
walkable environment with access to transit, employment and shopping needs.
There is an inherent built-in cost that comes in the form of transportation
maintenance and fees, which is often more of a hidden cost to lower-income families
who only look at the price tag of land and housing rather than the cost of the
lifestyle. Urban setting, however, are up front about their costs through rent
and housing prices and then it is up to the inhabitant how much they want to
pay for transportation (I pay about $500 dollars annually for bus passes, occasional
gas for a friend's vehicle and bike maintenance), entertainment (movie tickets
vs the cost of a big screen tv and blu ray player), recreation (personal pool
vs communal taxes that contribute towards a neighborhood rec center with a pool),
and shopping (getting what you need at the store to eat daily on the way home
from work at the corner grocery vs buying weekly or monthly in bulk and inevitably
throwing food away or eating too much and shopping for entertainment and recreation
in suburbs versus socializing on city streets or in cafes).
Urban living provides the opportunity to live as cheaply or expensively as you
want. Suburban living offers a much narrower choice selection and the cheapest
suburban lifestyle is more expensive than the cheapest urban.
British analysis
Submitted by PhilBest on Fri, 07/08/2011 - 18:38.
Between the work done by Peter Hall, and the Barker Review, a lot of valuable papers have been published by Alan W. Evans and colleagues from the University of Reading; and by Paul Cheshire and colleagues from the London School of Economics.
Britain provides a conclusive case study AGAINST urban growth containment. The benefit-cost ratio is steeply negative; such "benefits" as there are, are captured by higher income groups; the net cost to society and the economy as a whole is literally dozens of times higher than the "benefit". The overall, system-wide "intended" benefits of urban growth containment do not in fact materialise; "benefits" are frequently highlighted in "studies" by the likes of Todd Litman, that in fact focus on the higher-income-group-inhabited "ideal" communities and compare these with the rest who in fact cannot afford to "buy in" to the "ideal" communities, and never would.
In fact, the "ideal" communities (walkable, transit-oriented, etc) cannot be other than victims of their own success as long as real estate markets and private property remain "free". Of course the price of these communities will rise, and rise all the more if they are the recipients of regulatory monopoly enabling of rent-seeking.
"Smart Growth" is a repugnant, oppressive elitist ideology dressed up in high flown, idealised noble rhetoric. The sooner that "the poor" realise this and turn against the left wing political parties that have betrayed them in favour of ideologies of "planning", the better.
Login or register to post comments
Email this commentEmail this comment
Other Research Reaches Different Conclusions
Submitted by Todd Litman on Fri, 07/08/2011 - 17:32.
This analysis overlooks a number of important factors. A considerable body of research reaches very different conclusions about smart growth impacts on overall affordability and economic development (Litman 2009; Tomalty and Haider 2008).
Mr. Cox assumes that smart growth consists simply of regulatory restrictions
such as urban growth boundaries. In fact, smart growth includes a variety of
policies that encourage (SGN 2011):
* Land use mix
* More compact development
* More diverse housing types
* More connected street networks
* Improved walking and cycling conditions
* Improved public transit services
* Better coordination between transport and land use development
* Redevelopment of existing urban neighborhoods
* More efficient parking management
* Location-based development fees and utility pricing
Many of these strategies help reduce costs and increase affordability (Blais 2010; Litman 2008). For example, more diverse housing types and more efficient parking management can reduce development costs and therefore housing affordability, and improved transport options (better walking, cycling and public transit services) reduce household transportation costs.
It is true that, by restricting land supply, urban growth boundaries can increase land costs per acre, this can be offset by other smart growth strategies that reduce land requirements per housing unit. The claim that smart growth increases housing costs is incomplete; this is only true if a community maintains other regulations that limit density increases, such as generous minimum parking requirements and limitations on more compact housing types.
Cox fails to explore the direction of causation. Yes, in general housing costs are higher in communities with urban growth boundaries but this probably results, at least in part, because such regulations tend to be implemented in rapidly-growing regions where housing costs would be relatively high in any case (Nelson, et al. 2002).
Most experts now recognize that affordability should be evaluated based on housing and transportation costs combined, since households often make trade-offs between these costs. A household is no better off with cheaper housing if their savings are offset by higher transportation costs (ULI 2009).
It is not true that housing foreclosure rates are higher in smart growth areas. On the contrary, foreclosure rates tend to be higher in automobile-dependent, urban fringe locations (NRDC 2010). Households in such locations are more vulnerable to fuel price spikes, traffic accidents and vehicle failures (Dodson and Sipe 2006). These risks will increase in the future if petroleum prices rise as most experts predict.
This analysis is incomplete and biased. Mr. Cox has cherry-picked his data and references. More comprehensive and objective analysis indicates that smart growth increases some costs but reduces others, and if properly implemented can provide substantial savings and benefits. It is inaccurate to blame housing speculation and bubbles on smart growth.
For More Information
Pamela Blais (2010) "Perverse Cities: Hidden Subsidies, Wonky Policy, and Urban Sprawl," UBC Press (http://perversecities.ca).
Affordable Housing Design Advisor Website (www.designadvisor.org), sponsored by the U.S. Department of Housing and Urban Development, provides information on developing more affordable housing.
Jago Dodson and Neil Sipe (2006), "Shocking the Suburbs: Urban Location, Housing Debt and Oil Vulnerability in the Australian City," Research Paper 8, Urban Research Program, Griffith University (www98.griffith.edu.au/dspace/bitstream/10072/12665/1/41353.pdf ).
Housing + Transportation Affordability Index (http://htaindex.cnt.org).
HUD (2008), “Parking Regulations and Housing Affordability,” Regulatory Barriers Clearinghouse, Volume 7, Issue 2, US Department of Housing and Urban Development, (www.huduser.org); at www.huduser.org/rbc/newsletter/vol7iss2more.html.
ITE (2010), "Smart Growth Transportation Guidelines, Recommended Practice," Institute of Transportation Engineers (www.ite.org); at www.ite.org/emodules/scriptcontent/Orders/ProductDetail.cfm?pc=RP-032A.
Jonathan Levine (2006), "Zoned Out: Regulation, Markets, and Choices in Transportation and Metropolitan Land-Use," Resources for the Future (www.rff.org).
Todd Litman (1998), "Parking Requirement Impacts on Housing Affordability," (www.vtpi.org/park-hou.pdf )
Todd Litman (2005), "Understanding Smart Growth Savings: What We Know About Public Infrastructure and Service Cost Savings," Victoria Transport Policy Institute (www.vtpi.org/sg_save.pdf ).
Todd Litman (2009), "Evaluating Criticism of Smart Growth," (www.vtpi.org/sgcritics.pdf ).
Todd Litman (2010), "Affordable-Accessible Housing In A Dynamic City: Why and How To Support Development of More Affordable Housing In Accessible Locations," (www.vtpi.org/aff_acc_hou.pdf ).
Todd Litman (2011b), “Can Smart Growth Policies Conserve Energy and Reduce Emissions?” Portland State University’s Center for Real Estate Quarterly (www.pdx.edu/realestate/research_quarterly.html), Vol. 5, No. 2, Spring, pp. 21-30; at www.vtpi.org/REQJ.pdf.
Arthur C. Nelson, Rolf Pendall, Casy Dawkins and Gerrit Knaap (2002), "The Link Between Growth Management and Housing Affordability: The Academic Evidence," Brookings Institution Center on Urban and Metropolitan Policy (www.brook.edu/dybdocroot/es/urban/publications/growthmang.pdf.
NRDC (2010), "Reducing Foreclosures and Environmental Impacts through Location-Efficient Neighborhood Design," Natural Resources Defense Council (www.nrdc.org); at www.nrdc.org/energy/files/LocationEfficiency4pgr.pdf.
Ray Tomalty and Murtaza Haider (2008), "Housing Affordability and Smart Growth in Calgary," Plan-It Calgary, City of Calgary (www.calgary.ca/docgallery/BU/planning/pdf/plan_it/housing_afford_and_sma... ).
SGN (2011), "What is Smart Growth?," Smart Growth Network and US Environmental Protection Agency (www.epa.gov/smartgrowth/about_sg.htm).
ULI (2009), "Beltway Burden: The Combined Cost of Housing and Transportation in the Greater Washington, DC Metropolitan Area," Terwilliger Center for Workforce Housing, Urban Land Institute ( http://commerce.uli.org/misc/BeltwayBurden.pdf ).
Todd Litman is founder and executive director of the Victoria Transport Policy Institute (www.vtpi.org), an independent research organization dedicated to developing innovative solutions to transport problems.
Login or register to post comments
Email this commentEmail this comment
Todd Litman is wrong on so many levels
Submitted by LeithVO on Fri, 07/08/2011 - 22:07.
Todd litman makes so many factual areas it is hard to know where to start. Let's examine some of his claims one by one.
Cox fails to explore the direction of causation. Yes, in general housing costs are higher in communities with urban growth boundaries but this probably results, at least in part, because such regulations tend to be implemented in rapidly-growing regions where housing costs would be relatively high in any case (Nelson, et al. 2002).
Not true. The fastest growing regions in the US tend to be those without "smart growth" strategies (e.g. Texas, Georgia, North Carolina). By contrast, the leading smart growth advocates - California, Oregon and Washington - are growing more slowly.
Most experts now recognize that affordability should be evaluated based on housing and transportation costs combined, since households often make trade-offs between these costs. A household is no better off with cheaper housing if their savings are offset by higher transportation costs (ULI 2009).
Yet Smart Growth has failed miserably to reduce sprawl. In fact, there is significant evidence that constraints like UGBs exacerbate sprawl as they force lower income households to leapfrog the boundary into far flung exurban satelite cities and towns where homes are more affordable.
It is not true that housing foreclosure rates are higher in smart growth areas. On the contrary, foreclosure rates tend to be higher in automobile-dependent, urban fringe locations (NRDC 2010).
Rubbish. The states with the largest share of households in negative equity are (in order): Nevada, Arizona, Florida and California. All have some form of urban growth constraint.
Households in such locations are more vulnerable to fuel price spikes, traffic accidents and vehicle failures (Dodson and Sipe 2006). These risks will increase in the future if petroleum prices rise as most experts predict.
See my comment above on Smart Growth tending to exacerbate sprawl. Also, you wrongly assume that most people commute into the central core for employment, when the opposite is in fact the case. America's cities are decentralised with most people working in the suburbs.
This analysis is incomplete and biased. Mr. Cox has cherry-picked his data and references. More comprehensive and objective analysis indicates that smart growth increases some costs but reduces others, and if properly implemented can provide substantial savings and benefits. It is inaccurate to blame housing speculation and bubbles on smart growth.
No it is your analysis that is incomplete, biased and wrong. If Smart Growth is so beneficial, can you please explain why millions of Americans are voting with their feet and leaving the West Coast and settling in the liberated markets of Texas, Georgia, North Carolina, amongst others where the dream of affordable housing is still alive? Obviously they have a different view of the so-called benefits of Smart Growth.
Login or register to post comments
Email this commentEmail this comment
Thanks for your comments
Submitted by Mark Schill on Wed, 07/13/2011 - 09:28.
Thanks for your comments LeithVO. Let me respond to some of points you raise.
As planners use the term, "smart growth" refers to a set of policies of which urban growth boundaries are just one. I can understand your objections to that strategy, but people truly concerned about affordability should support other smart growth strategies that reduce development costs (reduced parking and setback requirements, more compact and diverse housing types, location-based development and utility fees) or reduce household transportation costs (more compact, mixed development, improvements to alternative modes).
I don't think the data (http://www.realtytrac.com/foreclosure/foreclosure-rates.html ) support your claim that foreclosure rates are higher in smart growth. At the state level, for example, Georgia and Michigan have higher rates than Oregon, Washington, and the North East states. Within regions, foreclosure rates tend to be higher in sprawled, automobile-dependent area than in more compact, multi-modal, which justifies "location efficient mortgages" (NRDC 2011; Rauterkus, Thrall and Hangen 2010).
There is significant consumer demand for smart growth locations (see my 2009 review). The high prices for housing in smart growth communities reflects consumer demands and reduced transport costs that are capitalized into property values. To the degree that this is true, the key to increasing housing affordability is to significantly increase the supply of such housing by supporting more smart growth development. Apparently many people want to live in cities such as San Francisco, Seattle, Boston, and so are willing to pay a housing premium in exchange for other amenities. Housing there can become more affordable if other towns and cities, including suburbs, created the types of compact, mixed, walkable neighborhoods that many people prefer.
References
Pamela Blais (2010), "Perverse Cities: Hidden Subsidies, Wonky Policy,
And Urban Sprawl," UBC Press (www.ubcpress.ca); at www.perversecities.ca.
Joe Cortright (2008), "Driven to the Brink: How the Gas Price Spike Popped
the Housing Bubble and Devalued the Suburbs," CEOs for Cities (www.ceosforcities.org);
at www.ceosforcities.org/newsroom/pr/files/Driven%20to%20the%20Brink%20FINA....
HUD (2008), “Parking Regulations and Housing Affordability,” Regulatory
Barriers Clearinghouse, Volume 7, Issue 2, US Department of Housing and Urban
Development, (www.huduser.org); at www.huduser.org/rbc/newsletter/vol7iss2more.html.
Todd Litman (2009), Where We Want To Be: Home Location Preferences And Their
Implications For Smart Growth, Victoria Transport Policy Institute (www.vtpi.org);
at www.vtpi.org/sgcp.pdf.
Todd Litman (2010), "Affordable-Accessible Housing In A Dynamic City: Why
and How To Support Development of More Affordable Housing In Accessible Locations,"
Victoria Transport Policy Institute (www.vtpi.org); at www.vtpi.org/aff_acc_hou.pdf.
NRDC (2010), "Reducing Foreclosures and Environmental Impacts through Location-Efficient
Neighborhood Design," Natural Resources Defense Council (www.nrdc.org);
at www.nrdc.org/energy/files/LocationEfficiency4pgr.pdf.
Stephanie Y. Rauterkus, Grant I. Thrall and Eric Hangen (2010), “Location
Efficiency and Mortgage Default,” Journal of Sustainable Real Estate (www.costar.com/josre/default.htm),
Vol. 2, No. 1, pp. 117-141; at www.costar.com/uploadedFiles/JOSRE/JournalPdfs/06.117_142.pdf.
Todd Litman is founder and executive director of the Victoria Transport Policy Institute (www.vtpi.org), an independent research organization dedicated to developing innovative solutions to transport problems.
Login or register to post comments
Email this commentEmail this comment
Australian Perspective
Submitted by Tony Recsei on Fri, 07/08/2011 - 23:35.
The facts do not support Todd Litmann’s contentions. Looking at the data since 1982 one can see a striking relationship between decreasing greenfield lot production and increasing Sydney house prices. During that period construction costs remained relatively constant.
The difference between transport costs in high-density and low-density areas is negligible compared to the increase in housing cost caused by high-density policies – for the former see Lenzen et al, Ecological Economics 49, 2004,375-399.
Login or register to post comments
Email this commentEmail this comment
From the Congress of New Urbanism Website
Submitted by Rick Harrison on Fri, 07/08/2011 - 11:27.
These are quotes from a few months ago clipped from the www.cnu.org:
"Today, CNU has over 3,100 members in 20 countries and 49 states. Federal cabinet secretaries and state governors (are proud to call themselves New Urbanists)…
More importantly, there are now over 210 New Urbanist developments under construction or complete in the United States.
Real estate in these developments often sells at a premium compared to conventional sprawl"
In other words...
The vast majority of these developments would be cosidered 'gentrified'... mecca's for the upper income strata, few would be on the more affordable scale. The end result is "Smart Growth" would not compare well from an affordability perspective to other methods in design and implementation.
Login or register to post comments
Email this commentEmail this comment
Urban Echo Values and True Rural Values
Submitted by Hugh Pavletich on Sat, 07/09/2011 - 00:47.
Thank you for a most informative article.
The Global Financial Crisis was clearly caused by poor urban planning, starving fringe land supply, which "triggered" the unfortunate and indeed unnecessary housing bubbles.
Sadly, too many economists and commentators still "put the cart before the horse", in not recognising that the California housing bubble burst a year prior to the Lehmans collapse.
Mike Insulmann, founder and CEO of MetroStudy, the widely respected real estate research firm, made this clear a year or two ago at a Texas Real Estate Editors Conference, that artificial land supply scarcity was the "trigger" - finance (in all its forms - equity - bubble equity - mortgage debt) was simply the "fuel".
Lending institutions simply had no alternative other than to engage in high income multiple lending, if they wished to operate in markets such as California. Herb Greenberg explained how lending got out to 11 times annual household earnings in California. Lending institutions wouldnt last five minutes in California, if they were lending at Texas multiples of 2.5 times annual household earnings.
No wonder these lending institutions were keen just to "clip the ticket" and offload the risks to the gullible via the vehicle of securitization. Very sensible risk management indeed - putting aside the ethics of it all.
I note you quote Dr Arthur Grimes, Chair of the Reserve Bank of New Zealands comment that fringe land prices are 10 times higher at the fringe boundary of Auckland.
They are in fact much higher.
I spoke with Dr Grimes on this matter and the "10 times higher" figure is in fact the difference between inside the urban zone and directly outside it, which is referred to as the Urban Echo Value. This has a much higher value, than True Rural Value, because part of the potential future urban zoning value is built in to it.
In New Zealand, it is not uncommon for the True Rural Value to be say $20,000 per hectare and the artificially constrained fringe Raw Urban Land Value to be $1,000,000 per hectare.
Thats some 50 times higher. In the South East of the United Kingdom as Dr Tim Leunig explained some years ago, it can be a stratospheric 500 times higher.
This means New Zealanders in the major urban areas are forced to pay $200,000 to $300,000 for a fringe serviced lot, when without Smart Growth, they would be paying $30,000 to $60,000.
Completed fringe housing (house and land packages) should be below $200,000, indeed nearer the $140,000 mark.
New Zealanders cant buy the sericed lot for that !
In turn, this has severely disrupted the performance of the residential construction sector as well. New Zealanders pay twice as much per square metre as they should have to. Understandably, build rates per 1000 population are exceedingly low at just 2.5 / 1000 population per annum. The general standard of the housing stock is therefore very poor.
Dr Grimes grossly understated the extent of the price diferences, by confusing Urban Echo Value with True Rural Value - something he recognises as well.
It is these unnecessary artificial fringe scarcity values policymakers must focus on eliminating. It helps all forms of urban development if land is priced at its true market value.
Smart Growth, starving fringe land supply, has proven to be a curse, severely disrupting the recovery process following the 3 Christchurch earthquakes. It has precipitated severe outwards migration (likely 10% of the population). The visible costs are likely to be in excess of $17 billion plus according to New Zealanf Treasury. Without Smart Growth, they would have likely been less than half that.
Expect the insurance industry to reassess the additional risks and costs of Smart Growth globally going forward.
There is currently a mad scramble to get affordable land opened up on the fringes, to allow recovery to finally get underway some 10 months following the first earthquake event 4 September 2010.
Christchurch would have been able to immediately and spontaneously respond by building new housing out on the fringes, if there had been affordable "construction ready" lots available.
Smart growthers / dense thinkers would be well advised to stay out of Christchurch at the moment. The Christchurch City Council can expect a massive cleanout of these people before long - as it moves from the centralized to the "One City - Many Communities" model.
The days of playtime urban governance and planning are over in Christchurch, New Zealand.
Smart Growth should properly be described as the destructive fantasy of poorly governed public bureaucracies, on a power trip. Its got nothing to do with reality.
Hugh Pavletich
www.PerformanceUrbanPlanning.org
Christchurch
New Zealand