Flight
from Urban Cores Accelerates: 2016 Census Metropolitan Area Estimates
by Wendell Cox 03/24/2017

Flight
from Urban Cores Accelerates: 2016 Census Metropolitan Area Estimates
by Wendell Cox 03/24/2017
The flight from the nation’s major metropolitan area core counties increased 60 percent between 2015 and 2016, according to just-released estimates from the US Census Bureau (Note). A total of 321,000 more residents left the core counties than moved in, up from 199,000 in 2015. This is ten times the decade’s smallest domestic migration loss of 32,000 for the same counties which occurred in 2012.
Suburban counties continued to attract net domestic migrants, at a somewhat higher rate than in recent years and much higher than in the early part of the decade. The suburban counties gained 235,000 domestic migrants in 2016, compared to 224,000 in 2014 and more than double the low point of 113,000 in 2011 (Figure 1).
The 60 percent rise in net domestic migration out of the core counties converts to a 0.4 percent annual loss relative to last year’s population. This loss is more than one-half the annual growth rate of only 0.7 percent. This is a substantial deterioration from the net domestic migration loss in 2012 of 0. 04 percent, which was only 1/25th of the 1.1 percent growth rate for the core counties.
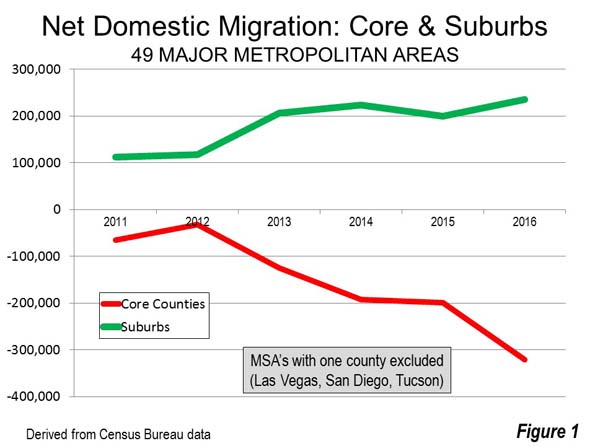
At the same time, the suburbs had their best performance of the decade. Their minimum advantage was in 2012, when the suburbs attracted 150,000 new domestic migrations relative to the core counties (118,000 compared to negative 32,000). The 2016 advantage was 556,000 (235,000 compared to negati ve 321,000).
The suburbs outperformed core county domestic migration in 40 of the 50 major metropolitan cases. The ten exceptions include three with strong urban cores (San Francisco, Boston and Washington) and seven with very small urban cores, indicating that much of the central county population is post-war suburban (see: Growth Concentrated in Most Suburbanized Core Cities).
Overall Domestic Migration
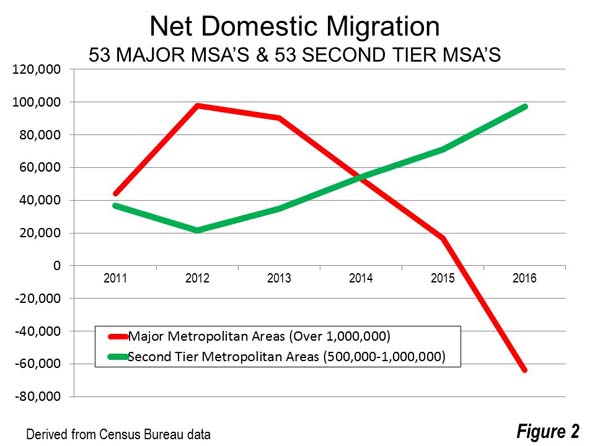
The deterioration in core county domestic migration led to overall negative domestic migration for the major metropolitan areas in 2016, the first time this has happened this decade. Overall, the 53 major metropolitan areas had a net domestic migration loss of 64,000, down from 17,000 in 2015 and 98,000 in 2012. Since the 2010 census, the major metropolitan areas have gained 222,000 net domestic migrants. This represents an overall net domestic migration rate of 0.13 percent relative to their 2010 population.
The big, and perhaps surprising, news here is that the “second tier” of metropolitan areas (between 500,000 and 1 million population) have begun to perform better than their larger counterparts, a result reminiscent of the last decade. These 53 metropolitan areas gained 97,000 net domestic migrants, topping the major metropolitan areas for the third year in a row (Figure 2). Since the 2010 census, second tier metropolitan areas have gained 334,000 domestic migrants. This is 0.92 percent of the 2010 census population, seven times the major metropolitan area figure of 0.13 percent.
Where People Are Moving To and Away From
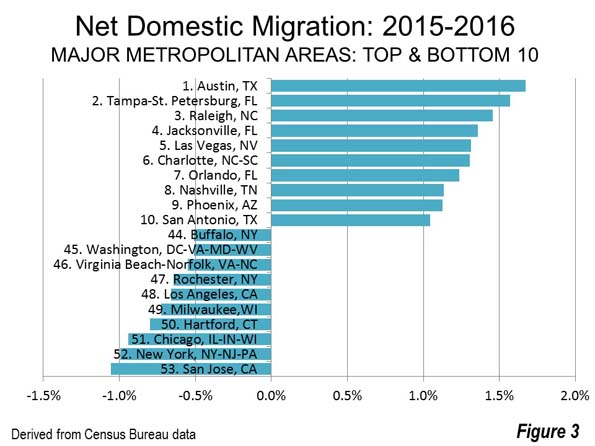
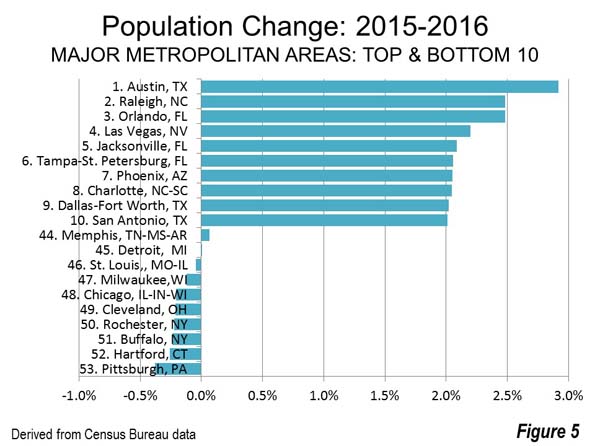
As has become customary, the greatest rates of domestic migration among the major metropolitan areas are overwhelmingly in the South. Austin is again number one, gaining nearly 1.7 percent from domestic migration. Austin is followed by Tampa St. Petersburg, Raleigh and Jacksonville. Las Vegas is the only non-southern major metropolitan area among the top five in net domestic migration. The second five includes four southern metropolitan areas, Charlotte, Orlando and Nashville, ranking sixth through eighth and San Antonio ranking tenth. Phoenix placed ninth.
The bottom 10 are a relatively familiar group of metropolitan areas, with San Jose placing last and being alone in having more than one percent (1.1 percent) of its population move away between 2015 and 2016. San Jose was also last in net domestic migration in the decade of the 2000s, if hurricane ravaged New Orleans is excluded. The bottom five also includes New York, Chicago, Hartford and Milwaukee. Los Angeles had the sixth worst net domestic migration, followed by Rochester, Virginia Beach-Norfolk, Washington and Buffalo (Figure 3).
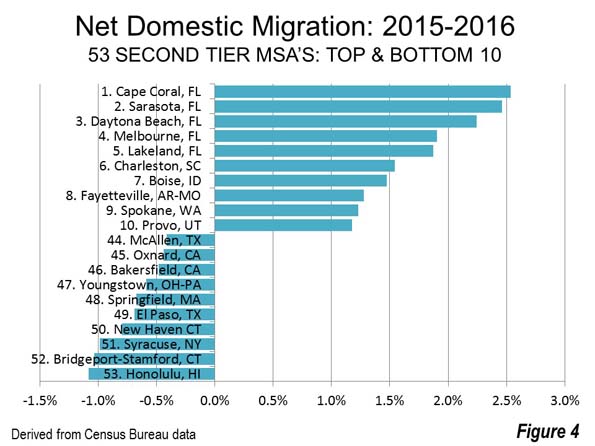
The net domestic migration leaders among the large metropolitan areas posted even stronger gains than Austin. All of the top five had greater net domestic migration rates, and all are in Florida. Leader Cape Coral added more than 2.5 percent to its population from domestic migration. Nearby Sarasota was near 2.5 percent in Daytona Beach was also over two percent. Melbourne and Lakeland were approximately 1.9 percent. The second five was led by Charleston, South Carolina, followed by Boise, Fayetteville AR-MO, Spokane and Provo, UT.
The largest domestic migration loss was in Honolulu, at 1.1 percent and slightly worse than San Jose (minus 1.08 percent compared to 1.06 percent in San Jose). Two of New York’s commuter rail exurbs ranked second and fourth worst, Bridgeport-Stamford and New Haven, while Syracuse ranked third. El Paso had the fifth worst net domestic migration. The second five worst in net domestic migration were Springfield, Massachusetts, Youngstown, Bakersfield, Oxnard and McAllen, Texas (Figure 4).
Population Rankings and Trends
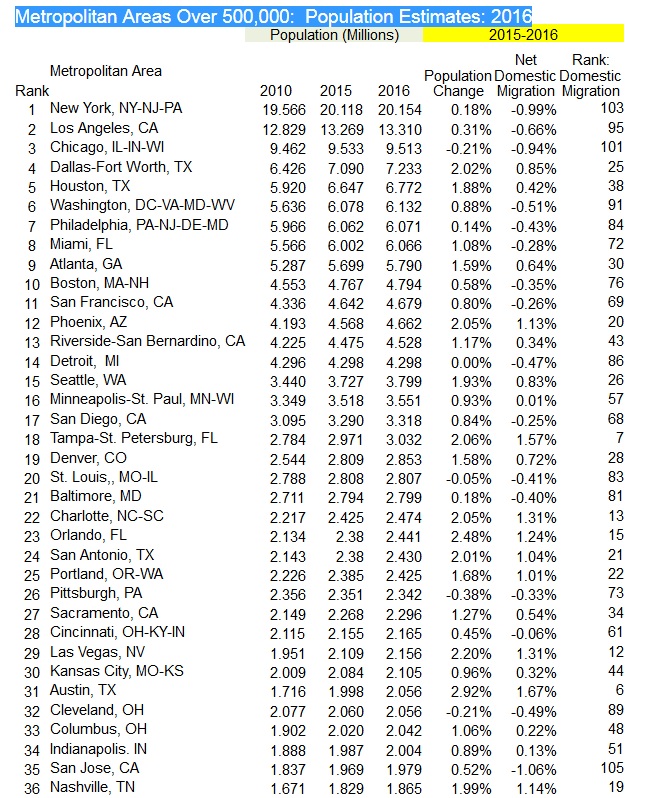
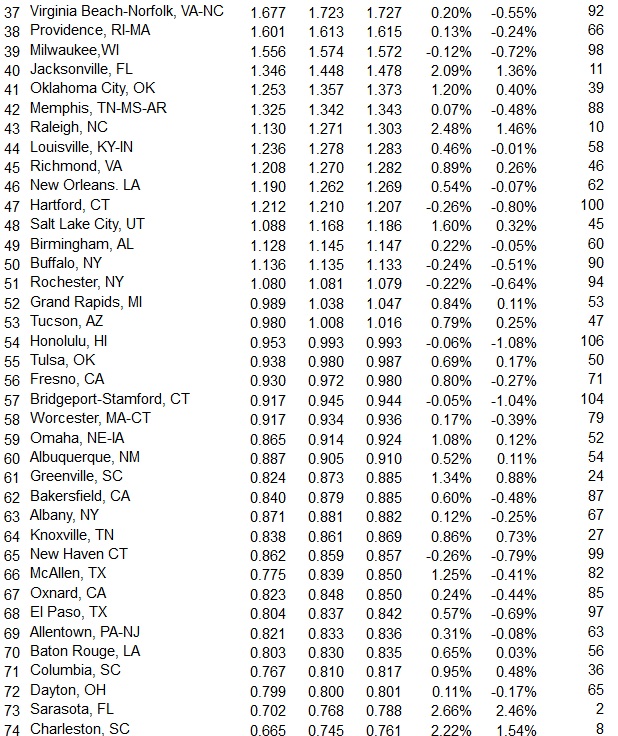
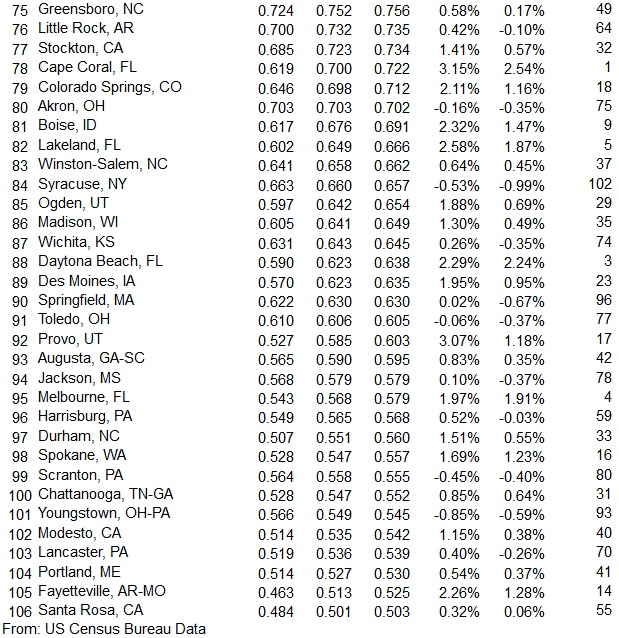
Again, New York, Los Angeles, Chicago, Dallas-Fort Worth and Houston were the largest. They were followed by Washington (which passed Philadelphia last year), Philadelphia, Miami, Atlanta and Boston. There was no change in the rankings of the top 22 major metropolitan areas. Portland dropped two notches, from 23rd to 25th largest, as both Orlando and San Antonio jumped ahead. Austin jumped 2 positions, passing both Cleveland and Columbus, becoming the 31st largest metropolitan area. Finally, Raleigh passed Louisville to become the 43rd largest metropolitan area. The table at the end of the article includes information on the 106 largest metropolitan areas.
The population growth rates for both the major and second tier metropolitan area leaders and trailers looks similar to the domestic migration rankings (Figures 5 and 6). Austin leads the majors and Cape Coral leads the large metropolitan areas. There are greater differences in the bottom ten, where some of the largest domestic migration losers (such as New York, Los Angeles and Chicago) attract strong international migration have been replaced by others that attract fewer, and tend to have lower population growth rates as a result.
More Major Metropolitan Areas?
Meanwhile, some metropolitan areas should soon pass the 1,000,000 mark. Honolulu has been at the top of the list for some time. If the annual growth rates from 2010 to 2013, 2014 or 2015 had been sustained, Honolulu would have reached a million by 2016. But, Honolulu’ growth rate has slowed substantially in each of the last years since 2012, culminating in a modest population loss in 2016, leaving Honolulu 7,000 short of a million. Current growth rates suggest that Tulsa and Fresno could get to a million before Honolulu.
Reason For Concern
While the domestic migration data has long since disproven any thesis of a general movement of people from the suburbs to the urban core, the escalation in core county domestic migration losses is cause for concern.
The urban cores are far nicer places than they were before. But their recovery has been all too concentrated ; meanwhile the rings around trendy downtown residential areas continue, as before the micro-core renaissance, to suffer serious poverty levels and other social ills more intensely than elsewhere. We have been down a similar road before, and have never recovered from the serious costs.
Note: Major metropolitan areas have more than 1,000,000 population. The domestic migration comparison between core and suburban counties is limited to 50 of the 53 metropolitan areas, because four have only one county (Las Vegas, San Diego and Tucson). The lowest geographical level at which domestic migration data is available is counties. The core counties are often so large that they include large suburban components. This makes for a more crude comparison than would be the case if more precise data were available.
Wendell Cox is principal of Demographia, an international public policy and demographics firm. He is a Senior Fellow of the Center for Opportunity Urbanism (US), Senior Fellow for Housing Affordability and Municipal Policy for the Frontier Centre for Public Policy (Canada), and a member of the Board of Advisors of the Center for Demographics and Policy at Chapman University (California). He is co-author of the "Demographia International Housing Affordability Survey" and author of "Demographia World Urban Areas" and "War on the Dream: How Anti-Sprawl Policy Threatens the Quality of Life." He was appointed to three terms on the Los Angeles County Transportation Commission, where he served with the leading city and county leadership as the only non-elected member. He served as a visiting professor at the Conservatoire National des Arts et Metiers, a national university in Paris.
Photo: Coral Gables Florida (MSA), largest domestic migration and population gain of any metropolitan area over 500,000 population, 2015-2016 (by author)